From Peak to Valley to Comeback?
The Phoenix real estate market peaked in August, 2006, as far as the lightning fast, white hot, crazy market went. Prices, however, continued to rise for another several months.
Once prices started dropping in 2007, they dropped fast and far, before bottoming out in late 2009 or early 2010.
For comparison purposes, I pulled sales data from the 4th Quarter of 2006, 2009, and 2015. This should give us a good read of where we've been and where we are currently.
Median Sales Price
Chart showing 4th Qtr 2006, 4th Qtr 2009, and 4th Qtr 2015 - for several cities in the East and West Valley. (click to enlarge)

It's clear that prices have rebounded a long way from the bottom, with a few cities' prices approaching their 2006 peak.
Here's the table containing the data, for those analysts out there.

Median Price per Square Foot
Same time frames, same cities, but this time we'll look at the price per square foot, as this will adjust for changes in prices due to larger or smaller homes being built over the last 10 years.


Number of Homes Sold
Once again we'll pull the same time periods and cities, only this time we'll put pricing aside and just look at how many homes have sold.


Some cities are relatively flat over all three periods, while others vary wildly, but I don't see a relationship to east-west, north-south, big-small, landlocked-outskirts, socioeconomic, etc.
Summary and Forecasting
What does all this mean? Well, that's the million dollar question.
Prices have been rising for seven years in a row, and they're getting close to peak levels in some cities. At the same time, I'm not sure how much wages have been rising. I know lots of people who are making the same amount (or less than) they made a decade ago, and not too many who are making significantly more. (although some of this is gut feeling, since I don't have access to everybody's current salary.)
It does feel as if employment levels have stabilized. I remember a time a few years ago when a job posting on craigslist brought about a hundred resumes on the first day. These days I know a couple companies who have had a harder time finding good help.
Last year I was worried about interest rates, or at least that there was so much more room for rates to increase compared with the opportunity for rate reductions. And what happened? Several countries' central banks have moved interest rates negative - banks have to actually pay interest to keep surplus money on hand!
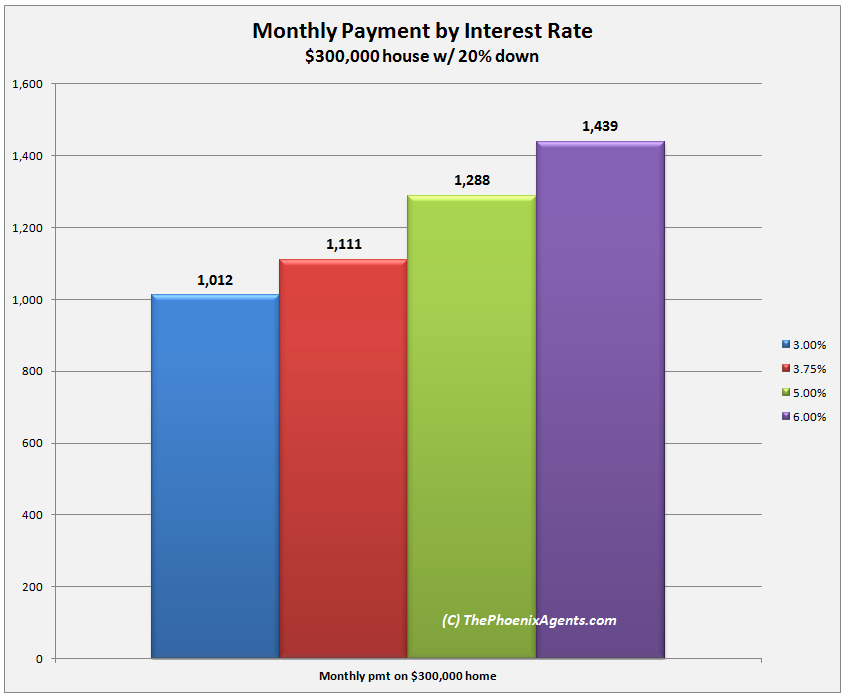
I'm not smart enough to figure out what is going to happen next, but I can say this is a strange economic environment - one we've never seen before. And I still think interest rates have more room to increase than to decrease. (The next chart below is from last year's post, showing how much an interest rate change can affect monthly payments.)
Final Advice
I'm not going to tell you whether to buy, or sell, or what city is "hot", or anything else you should be doing with your investment dollars.
I'll simply advise to be careful. Cover your bets. Make decisions based on well-crafted plans. Don't be surprised if the market doesn't do exactly what you expected it to.
And give Cheryl and myself a call if you have any real estate needs! (that's my best advice, after all.)
- Chris Butterworth
* All data was pulled from the Arizona Regional MLS system, for Single Family Residence detached homes which successfully closed escrow between October 1st and December 31st of 2006, 2009, and 2015. Data is believed to be accurate but not guaranteed.
.