More Stats - More Confusion
The Greater Phoenix area was built on suburban sprawl - going as far back as I can remember. (McCormick Ranch was a master planned community built way out in the middle of nowhere - back when Shea was the far northern end of the world in the mid-1970s!) This tremendous growth, which we have all known as "normal" over the last 40+ years, was built on 2 factors:
- Population growth, as people moved to Phoenix from other parts of the country.
- Trading up, as people and families traded their starter condo for a small house, and then their small house for a larger house, etc.
Today, I don't have current numbers for population inflows (I'll have to look into that), but the charts and stats tell me the 2nd factor is non-existent. That does not bode well for "normal."
Here are lots of charts & comments, with additional thoughts at the end:
Existing Home Inventory (nationally)
- Chart courtesy of www.calculatedriskblog.com
- Notice the rapid drop in inventory over the last couple years - this is putting upward pressure on prices nationwide. It's why there is so much media these days saying 2013 will see pricing increases.
Distressing Gap (nationally)
- Another great chart provided by www.calculatedriskblog.com
- This chart shows the gap that appeared in 2007-08 as existing home prices fell to the point at which new construction couldn't be built at a competitive price. The gap has remained wide due to the depressed pricing of foreclosed homes around the country.
- Locally, our gap has been receding as builders have ramped up production recently.
- Nationally, they expect to see this gap narrow over the next year or two as the wave of foreclosures recedes.
New Listings by Month - Maricopa County
- There's a seasonal dip at the end of every year, so we would expect November and December to be a little low.
- This year, November and December fell off a cliff. Where are the new listings?
- I'm hopeful this is seasonal only, and January's number shows strength.
- If not, what are people waiting for?
- Are we out of foreclosures?
- Are families trapped by negative equity? (and everyone who can/will short-sale/foreclose has already done so?)
- Are investors out of good deals, where they're able to find homes for pennies on the dollar?
- Now that prices are pointed upward, are families waiting for prices to get even higher?
- I don't know the cause, but I can tell you this isn't a normal market.
Occupancy of Homes Sold - Maricopa County
- This has been my bread and butter chart for years. The market won't be normal until there are far more occupied homes than vacant homes.
- The trend was going in the right direction in Spring 2012; what happened after that? Why did the gap widen again?
New Vacant Listings as a Percentage of the Total - Maricopa County
- Same as the chart above.
- When more than half of the new listings are vacant, we're not in a normal market.
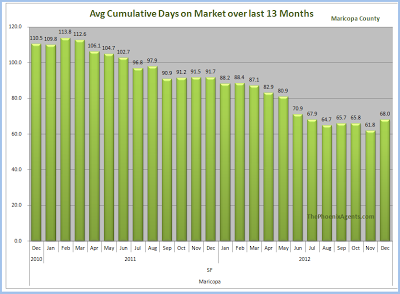
Days on Market - last 25 months
- Notice how fast the market heated up this year.
- Remember the last time the market heated up really quickly? Hint - it didn't end well..
Price per Square Foot - last 25 months
- Another angle of the same picture from above, showing how quickly the market has heated up.
- Approx. 5% increase in 2011. (76.6 to 80.2)
- Approx. 28% increase in 2012. (81.0 to 103.8). Does that sound like a market we would want to maintain?
- Notice the chart is leveling off. Maybe this is because we've reached the point where prices should be. Maybe this is seasonality and we're about to see another large price hike..?
Historical Price per Square Foot - Maricopa County
- Through 2002, prices were normal; appreciation was nominal.
- 2003 was the start of the bubble, and by early 2006 prices were way out of line.
- Prices today are about where they were in 2002-2003.
- Maybe we're priced about right today.
- If prices continue to rise, I'll contend we're heading into bubble territory. Especially since the traditional move-up market doesn't exist.
Additional Thoughts
- This is a stressful time here in Phoenix and Maricopa County. There's no sure direction on where the market is headed.
- Are prices stabilizing? Does that mean investors will start selling homes they've been renting, increasing supply and driving prices downward?
- Will more traditional move-up families decide it's time to sell their home and move up to another?
- Will the supply shortage continue, sending the buyers in the market into hyper-competitive mode, which then drives prices up further?
- And on top of everything else, what will happen to interest rates this year?
I have far more questions than answers these days, and it's not from lack of paying attention. This is just a very unique, very strange time in Phoenix history..
-Chris Butterworth
.


